How to Use FitTrace for Health, Fitness, and Weight Loss
May 8, 2019 by the FitTrace R&D team
Introduction
FitTrace is an app that collects over 50 data points from a single DXA body composition scan and presents the information in easy to understand charts and figures. Being a medical device, DXA has been adopted by the clinical, scientific, and research communities, who have produced thousands of research studies for more than fifteen years. A DXA printout can be overwhelming and difficult to interpret, particularly for someone without a medical or research background.
We will describe how FitTrace’s research-backed algorithms provide charts and reports that can be used to understand DXA body composition data, regardless of whether you are trying to lose weight, optimize athletic performance or simply trying to maintain a fit and healthy lifestyle.
What can you learn from a single DXA scan?
The table below (Figure 1) shows some of the data from a DXA body composition measurement. What can you learn from it?
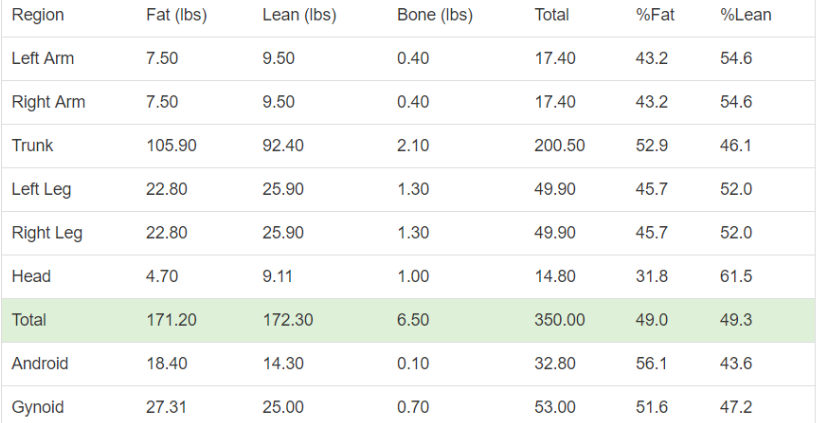
Figure 1: DXA produces “segmental” data – for each body part.
FitTrace can calculate risk factors for chronic health conditions based on a single DXA body composition scans. As mentioned earlier, this is based on clinical research trials.
Figure 2 shows two charts from the FitTrace app. The dial on the left shows current/lifetime risk of developing diabetes. The chart on the right shows the body composition of the same person.
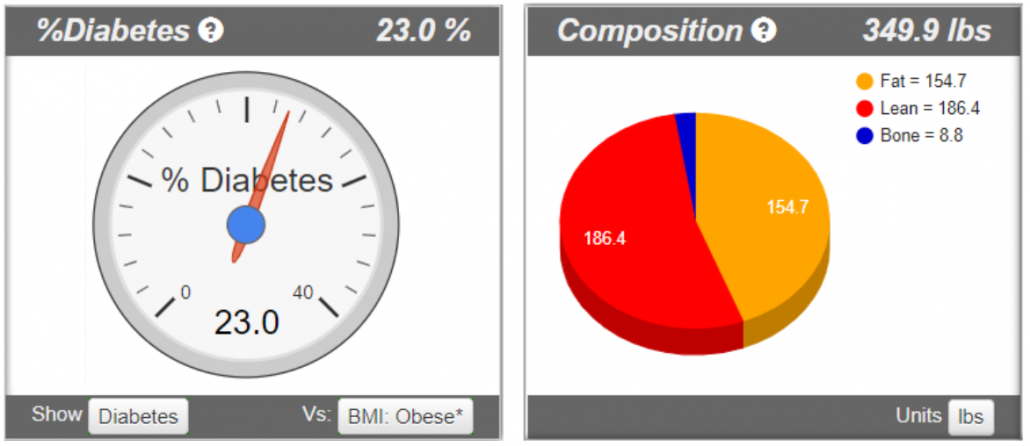
Figure 2: Health indicator shows risk of diabetes for a 350 pound male.
While the algorithm is somewhat complicated, the basic principle is based on the ratio of fat and lean mass in the torso and legs. For this example, to lower diabetes risk, the FitTrace user would need to lower fat and lean mass in the torso by a greater amount than in the legs. Only a segmental measurement, such as that from a DXA scan can provide this health indicator. The algorithm also factors in age, ethnicity, height, and weight to provide comprehensive and individualized health risk indexes, without having to give blood and no visit to a doctor.
FitTrace also ranks your body fat percentage into one of three categories based on published standards (see Figure 3). In addition, age, gender, and activity level (normal or active) are factored into this ranking. Activity level may be changed via the popup menu in the lower right of the dial.
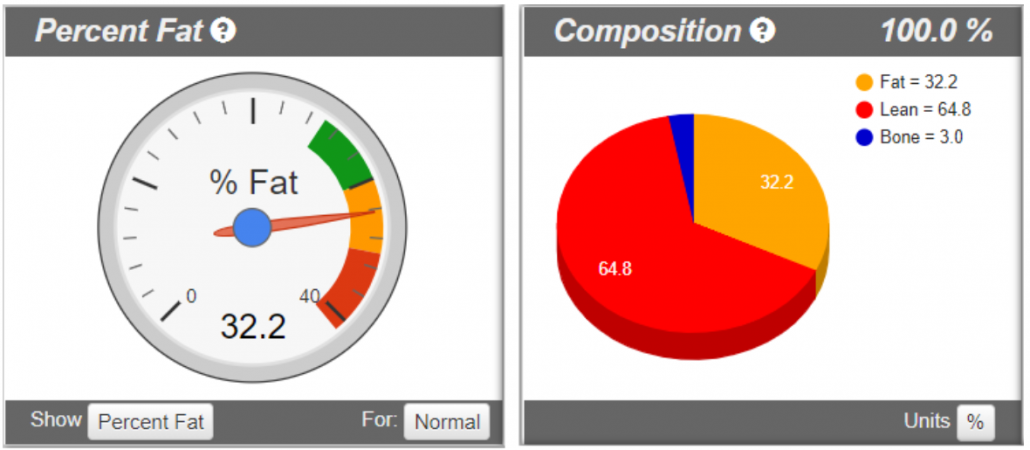
Figure 3: Classification based on body fat for a 60 year old female at Normal activity level
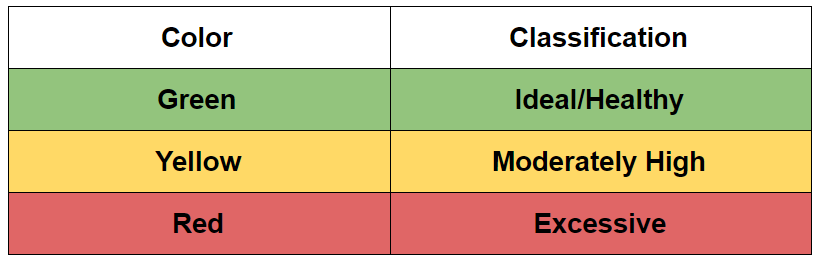
The color ranges on the dial represent the ranking system and depend on activity level (normal vs. active).
Physically Active ranges for ideal/healthy are lower compared to Normal. For example, someone could be in the Healthy range for normal, but be considered Moderately High for physically active.
Physically active men and women can benefit from having a lower body fat percentage because it allows them to use less energy and be more efficient while being active. Two examples could be a firefighter who needs to run into a burning building while wearing heavy equipment, or a basketball player who needs to run up and down the court without getting fatigued. Both can benefit from having a lower amount of fat mass compared to someone with a desk job or who is required to be less physically active. However, at a certain point having a large amount of body fat (excessive) or having lower than the ideal/healthy range could lead to increased health risks.
One of the benefits of DXA is that it captures body composition segmentally, meaning it shows how fat and lean are distributed throughout the body. Figure 4, from the FitTrace app, reveals an individual with a fairly even distribution of fat and lean mass in the arms and legs. The legs are each 22.8lbs fat and 25.9lbs lean. Depending on your health and fitness goals, you can use these charts to help determine if there is an imbalance in muscle/lean from one side of the body to the other as well as identify if there is more fat relative to lean mass in the arms compared to the legs.
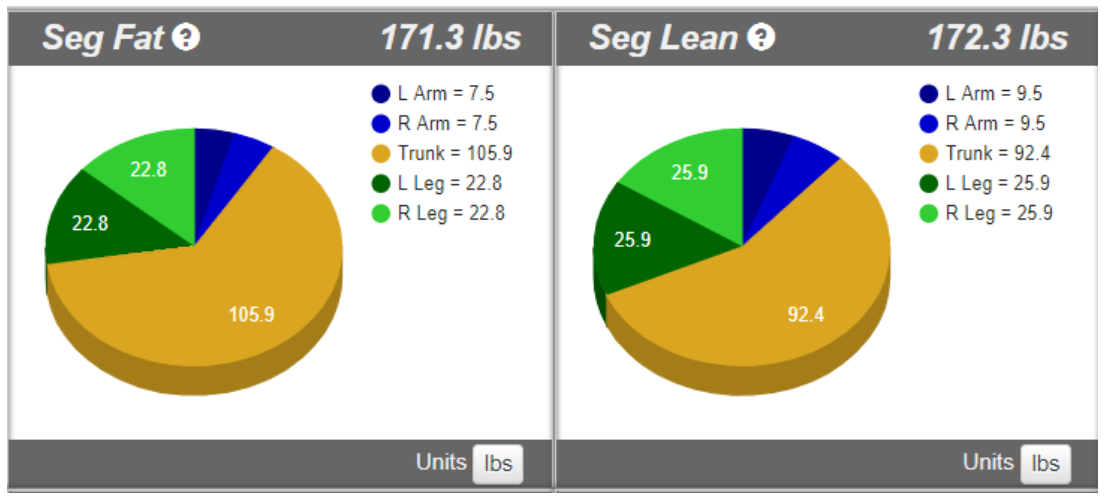
Figure 4: In this example, fat and lean are well balanced between arms and legs.
What About Multiple Scans?
Data from two or more DXA scans taken over time is even more complicated to understand and interpret than a single scan. FitTrace’s advanced tracking algorithms and reporting makes it easier to understand changes in body composition and overall health.
The FitTrace dashboard provides a general overview of multiple scans. Figure 5 shows a sequence of three measurements. A steady decline in weight can be observed, along with both a decrease in total lean total body fat mass.
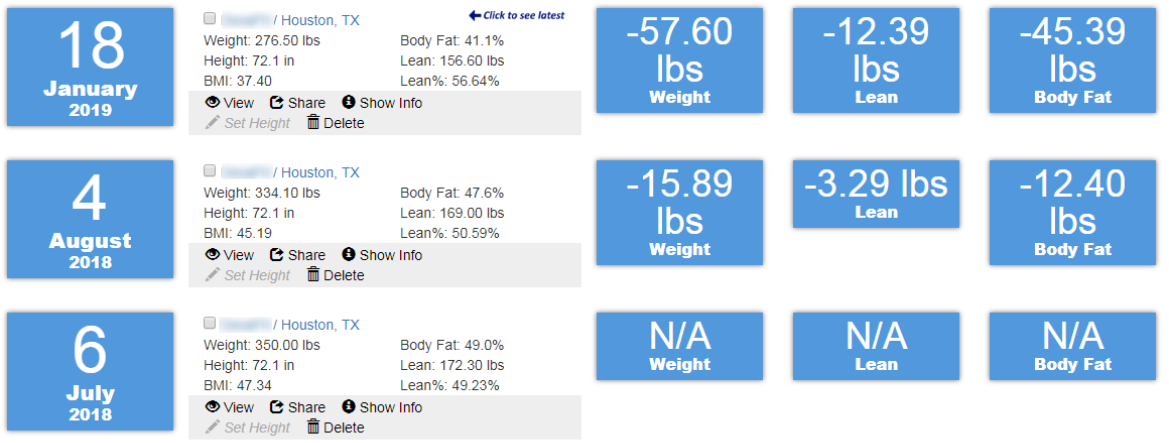
Figure 5: Dashboard shows a summary of measurements and absolute differences between measurements.
These changes in body composition can also be visualized via trending charts. Figure 6 shows at changes in total %Fat and %Lean.
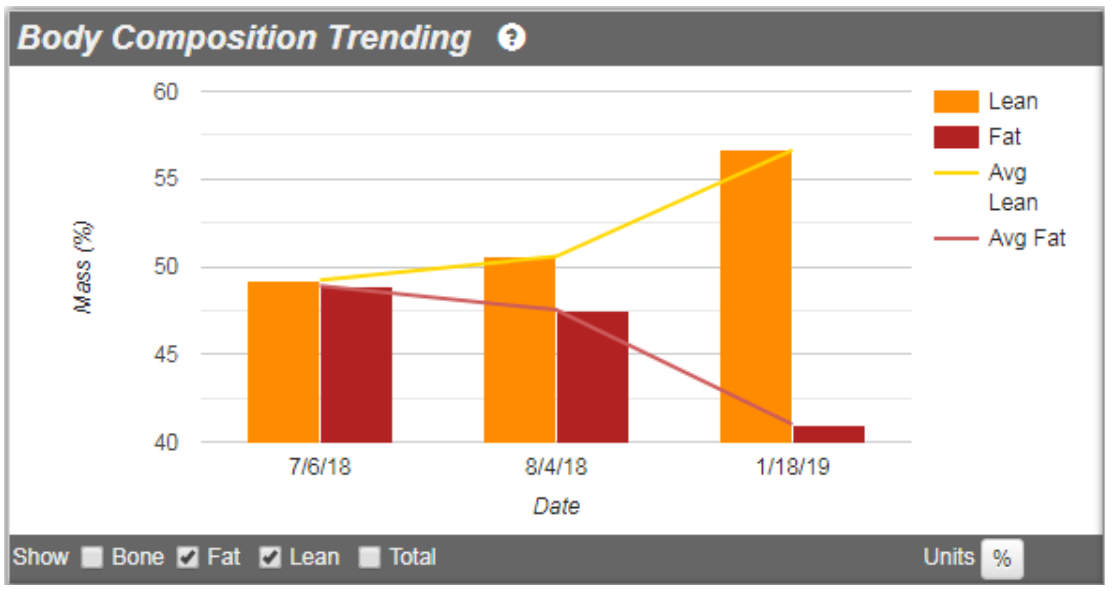
Figure 6: Trending of body composition showing percent change in fat and lean
Plotting your data as a percent (units) in the trending table can remove some confusion related to changes in lean and fat mass over time. It can be difficult to determine if a beneficial change has taken place without considering the amount of lean and fat tissue relative to total body weight. For example, there is often a decrease in both lean and fat mass when someone is losing weight. Because of this, the focus should be on the percent lean mass versus the percent fat mass. This is why it’s important to look at both absolute changes in the dashboard and percent fat and percent lean relative to total mass in the trending graphs.
Getting Expert Advice
FitTrace allows sharing of body composition measurements. Perhaps you want expert advice from your trainer or physician or nutritionist. Or maybe you want to share with friends for motivational reasons. A scan may be shared by clicking the Share button and then supplying an email address of the recipient when prompted.
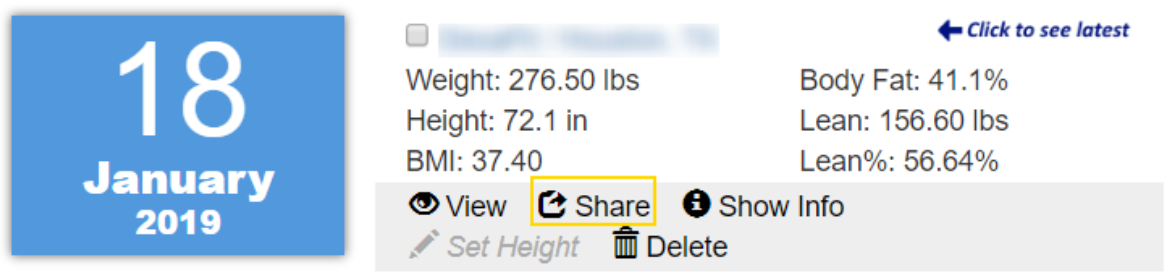
Figure 7: Scans may be shared by clicking Share
Note that you are in control of access to your information. See the FitTrace Privacy Policy for details.
Summary
FitTrace extends the functionality of DXA by taking advantage of 50+ data points and applying research-backed algorithms to calculate simple yet comprehensive reports. It provides an interactive environment that allows users to visualize and understand body composition data simply and easily. With this understanding, users can properly adjust their training and nutritional programs to meet their athletic, fitness, health, and weight loss goals.
Related Items
Video: Transferring DXA Scans from GE Healthcare enCORE Software Platform to FitTrace
Video: Using Fitbit with FitTrace
Blog: Five Reasons For Athletes to Have a DXA Body Composition Scan