Ignore The Z-score…for DXA Body Composition Measurements
Sept 6, 2019 by the FitTrace R&D team
Introduction
If you have used DXA for bone density testing then you are probably familiar with the Z-score. In this article, we’ll explain the Z-score, its significance, and why it may not be the best tool for body composition applications, particularly in athletics. We will also discuss how FitTrace uses advanced software analysis to help make body composition data easy to understand and interpret for athletes, coaches, trainers, nutritionists, physicians, etc. so they can make actionable decisions to optimize performance and health.
This article focuses on body composition. For information on how to assess bone density, see the International Society for Clinical Densitometry website. ISCD provides Official Positions for adults and children.
To get the most out of body composition measurements it is important to understand how one compares against others. Specifically:
- How does a single measurement from one athlete compare with another similar athlete?
- How does a linebacker’s lower body lean mass or percent fat compare against other linebackers on his team or in the NFL?
- Comparing a triathlete’s total body fat to highly-trained or elite triathletes?
- How do multiple measurements (changes) from one athlete compare to others?
- Were improvements seen in an athlete following a new training or nutritional program, such as an increase in lean mass or loss of body fat?
- Did one athlete improve more or less than others following the same training and nutrition program?
Purpose of the Z-score
The main purpose of a Z-score is to gain an understanding of how someone’s individual measurements compare against a group of people. DXA is a great tool for measuring body composition, in addition to fat, lean, and bone mineral content (BMC), DXA produces Z-scores. What is the Z-score and how useful is it for body composition?
What is a Z-score?
A Z-score represents the number of standard deviations (-3 to +3) above or below the average of measurements from a large group of people. A Z-score of +1 means that an individual’s measurement is one standard deviation greater than the average.
An alternative to Z-scores is percentiles. Percentiles are values on a scale from 1 to 100. A measurement at the 90th percentile means the measurement is 89% above all other values. For example, a male who weighs 290 pounds may be at the 95th percentile, meaning he weighs more than 94% of the sampled male population.
Figure 1 (below) is a graph showing how measurements from a group of people are distributed and how percentiles and Z-scores are related.
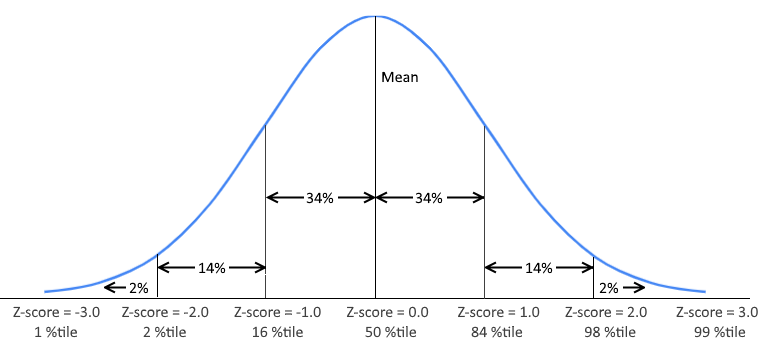
Figure 1: Z-score as they relate to percentiles
| Z-score | Percentile |
| -3.0 | 0.1% |
| -2.5 | 0.5% |
| -2.0 | 2% |
| -1.5 | 7% |
| -1.0 | 16% |
| -0.5 | 31% |
| 0.0 | 50% |
| 0.5 | 69% |
| 1.0 | 84% |
| 1.5 | 93% |
| 2.0 | 98% |
| 2.5 | 99.5% |
| 3.0 | 99.9% |
Table 1: Z-score to percentile
What’s wrong with the Z-score?
At FitTrace we believe there are better ways to understand body composition, than just a Z-score, particularly in athletics.
- A Z-score is not intuitive
- The group of people used to calculate Z-scores for DXA may be out-of-date
- The group of people upon which a Z-score is based may not be appropriate for athletic applications
Let’s look into each of these in more detail, while pointing out how the FitTrace DXA body composition app provides a more useful analysis for DXA body composition measurements.
A Z-score is not intuitive
Interpreting and visualizing Z-score values can be confusing. For example, what does a Z-score of +0.5 or -0.5 represent for a single measurement? It is not immediately obvious that:
| Z-Score value | Meaning in terms of percentiles |
| +0.5 | 69th percentile |
| -0.5 | 31st percentile |
A Z-score is even harder to interpret and visualize when comparing multiple measurements for the same person. For example, here’s how percentile changes with a Z-score change of just 1.0:
| Z-Score change | Meaning in terms of percentiles |
| From 1.0 to 2.0 | A change from 84th percentile to 98th percentile |
| From 0.0 to 1.0 | A change from 50th percentile to 84th percentile |
So how easy is it to explain a percent fat measurement change from -0.2 to +0.5, or a lean mass change from +0.6 to +1.0?
FitTrace provides a variety of intuitive ways of looking at your data for comparison, which are described throughout this article. For example, take a look at the bubble chart in figure 2. It is much more intuitive than Z-score. It plots an individual’s total percent fat vs other people by age. The red dot represents a specific person’s measurement. The blue dots are others of the same gender, the larger the dot the more people with similar measurements.
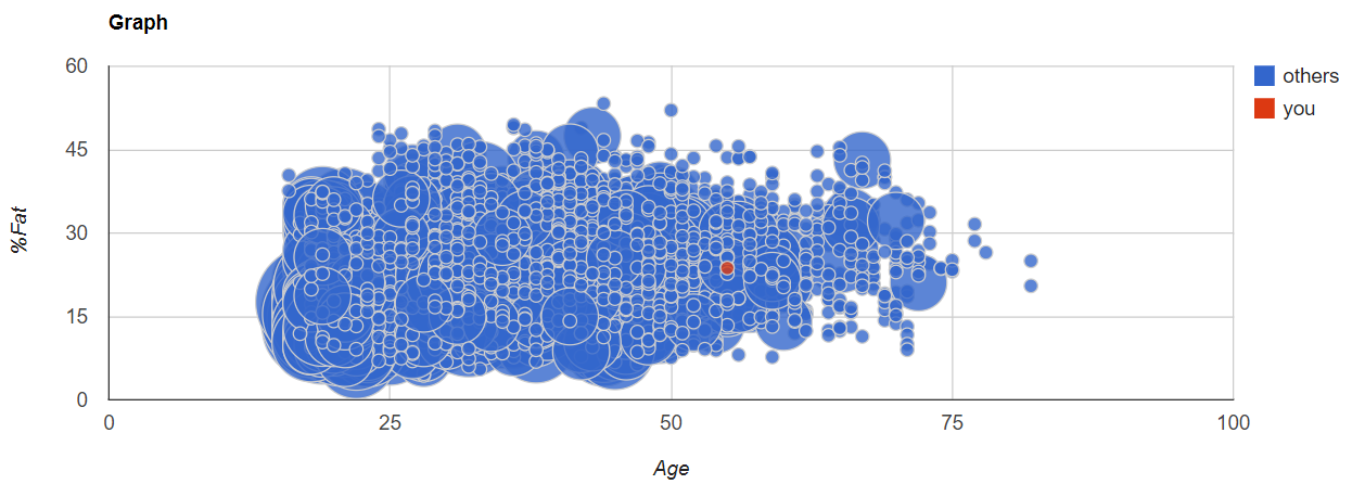
Figure 2: Bubble chart shows how an individual percent fat compares against others
DXA based Z-scores may be out-of-date
Being a statistical value, DXA Z-scores are based on a large group of people. Where does this group come from? That’s an interesting story.
Every year or so the government, CDC in particular, rolls into around 15 counties in the United States with its mobile examination truck. The truck is outfitted with a variety of devices to measure various aspects of health. Around 7,000 people each year, representing a broad range of the population, fill out detailed health questionnaires and undergo a variety of measurements. Many years, a DXA examination, bone density and/or body composition, is included in the testing. The data becomes part of the National Health and Nutrition Examination Survey (NHANES).
The last time DXA body composition scans were performed, as part of NHANES, was in 2005-2006. A larger set of DXA data comes from NHANES studies performed from 1999 to 2004. The Z-scores that are visible on the DXA printouts are derived from these studies. A typical DXA printout may include references to the NHANES data that it utilizes. Often times NHANES 2008 data is referenced. This date (2008) reflects the publication date of the data. The 1999-2004 data sets became available in 2008.
The population has changed drastically since then. Does data from 15 to 20 years ago still represent the current population? How useful is it for comparison with people today? With 1/3 of Americans now overweight and another 1/3 obese, it makes more sense to compare someone to the population NOW and not 15+ years ago.
The FitTrace app performs real-time analytics. FitTrace shows how an individual compares against all similar people of the same age and gender using current data. For example (see figure 3), the default FitTrace report shows fat, lean, and bone mass for each region along with the percentile (“%-tile”) and change from prior scan. The percentile values are calculated in real-time and are based on other FitTrace users of a similar age and gender.
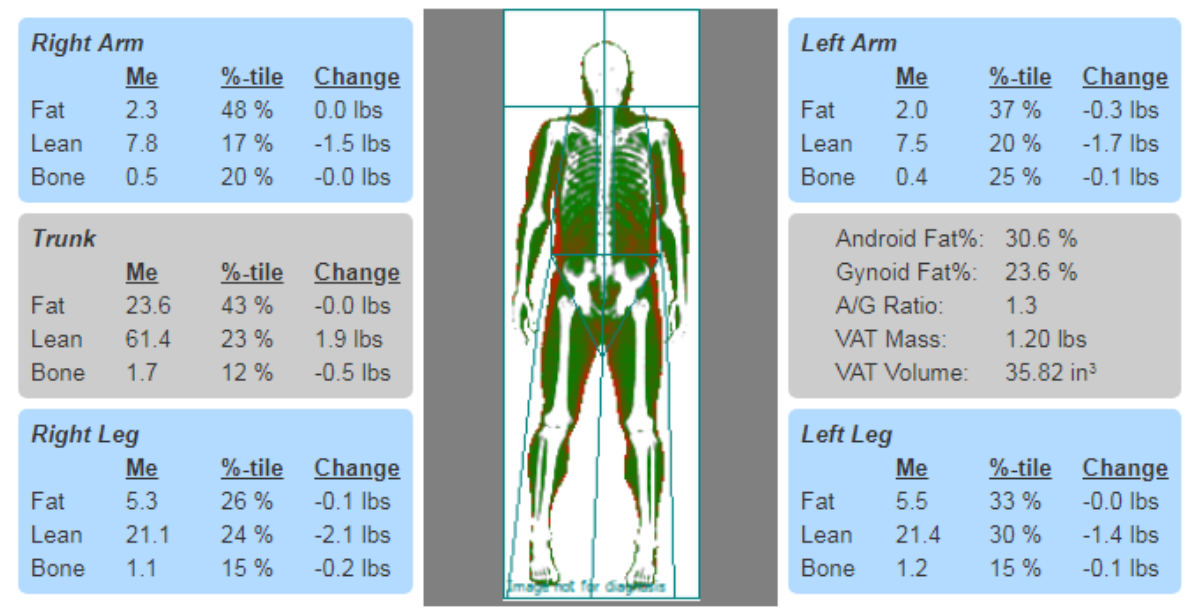
Figure 3: Sample body composition report with real-time percentiles
Z-scores may not be useful for athletes
In order to get the most out of out body composition measurements in athletes, it is critical to make appropriate comparisons. NHANES data, used by DXA to calculate Z-scores, is based on the general population, as mentioned in the previous section.
Is it useful to compare an athlete with the general population? The DXA-reported Z-scores are comparing athletes to a general population of typical American men or women, not athletes.
FitTrace provides more useful tools for comparison that can help answer questions like:
- How does my linebacker compare with NFL linebackers?
- How does this linebacker compare with other linebackers in my program?
- How do linebackers on my new training regimen compare with linebackers on my old training regimen?
Compare against prepared datasets built into FitTrace
FitTrace contains datasets of DXA based body composition measurements for multiple sports and positions. For example, a scan may be compared to NFL players by position (see figure 4).
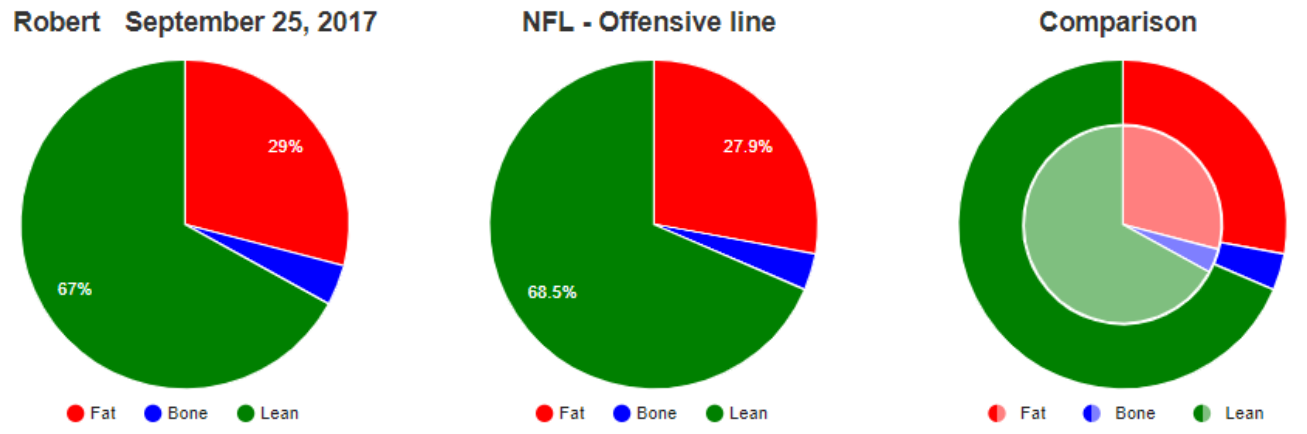
Figure 4: Comparison of an offensive lineman against an NFL data set built into FitTrace
Compare against your own athletes
Figure 5 shows the average lean mass of a basketball team by position over three years. That can be broken down further to look at individual players by position over those same years, and be compared against each other and over time (see Figure 6). This may be more insightful if you want to compare individual athletes to other similar athletes. Using this approach is also valuable when determining the effectiveness of nutrition and training programs.
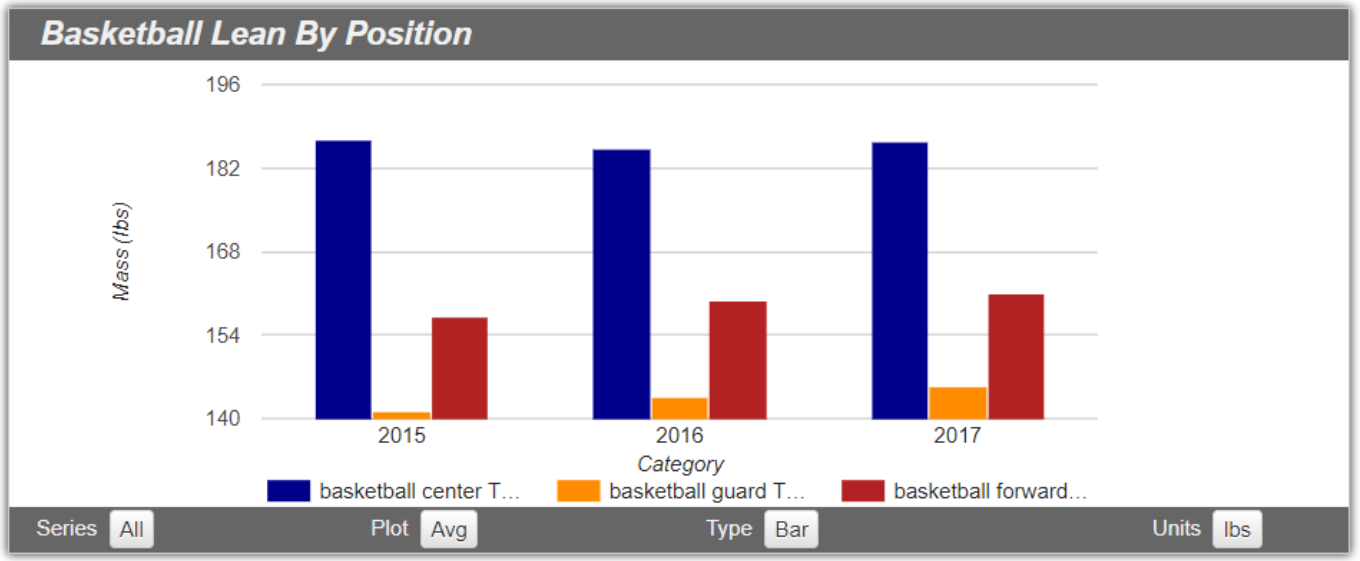
Figure 5: Average lean mass of a basketball team by position over three years
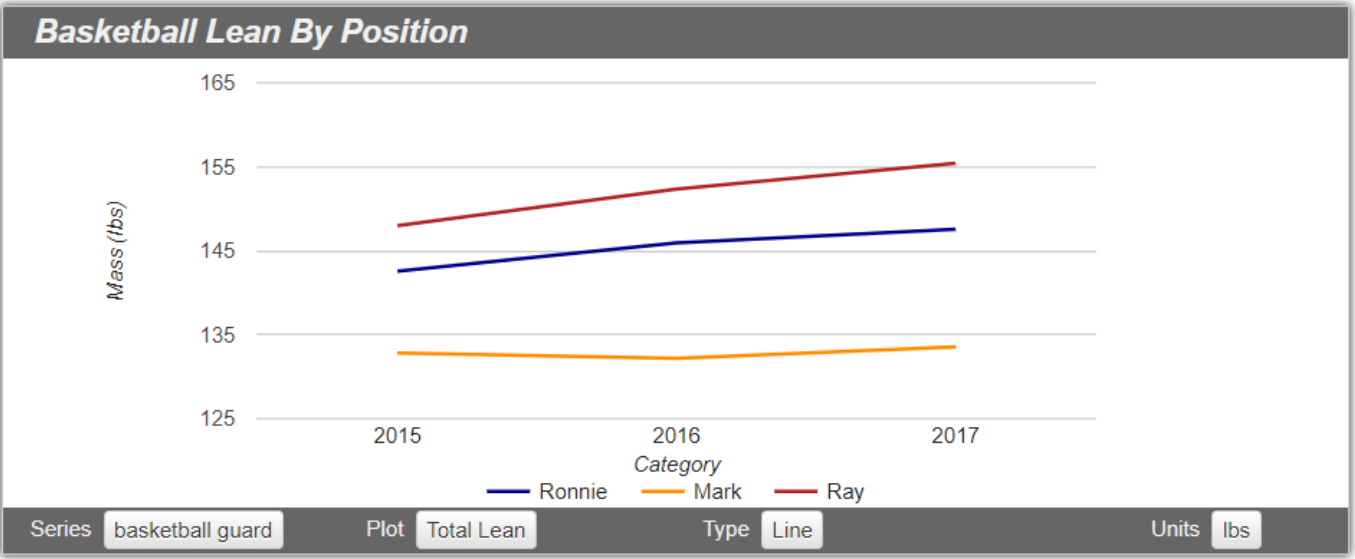
Figure 6: Individual basketball players’ lean mass (guards) compared over three years
Conclusion
There are clearly better ways than using a Z-score to understand how individual body composition measurements compare to others and changes over time. Using real-time analytics and interactive athlete data monitoring and reporting, FitTrace is a comprehensive and user-friendly tool to help coaches, trainers, nutritionists, physicians, and other personnel make actionable decisions that improve an athlete’s performance and health.
Related Items
Blog: Five Reasons For Athletes to Have a DXA Body Composition Scan